Java查看Old代对象具体信息
2020-04-21
 times read
times read
Contents
开启 GC 日志
java -XX:+PrintGCDetails -XX:+HeapDumpBeforeFullGC -XX:+PrintHeapAtGC
得如如下类似日志
[PSYoungGen: 611840K->992K(612352K)] 1260846K->650606K(1308672K), 0.0047655 secs] [Times: user=0.03 sys=0.00, real=0.01 secs]
Heap after GC invocations=30667 (full 91):
 PSYoungGen      total 612352K, used 992K [0x00000000da800000, 0x0000000100000000, 0x0000000100000000)
  eden space 610816K, 0% used [0x00000000da800000,0x00000000da800000,0x00000000ffc80000)
  from space 1536K, 64% used [0x00000000ffc80000,0x00000000ffd78000,0x00000000ffe00000)
  to   space 1536K, 0% used [0x00000000ffe80000,0x00000000ffe80000,0x0000000100000000)
 ParOldGen       total 696320K, used 649614K [0x00000000b0000000, 0x00000000da800000, 0x00000000da800000)
  object space 696320K, 93% used [0x00000000b0000000,0x00000000d7a63bf8,0x00000000da800000)
 Metaspace       used 69066K, capacity 70738K, committed 71936K, reserved 1114112K
  class space    used 7654K, capacity 8001K, committed 8192K, reserved 1048576K
}
可以看到 ParOldGen 对象的内存地址为 0x00000000b0000000,0x00000000d7a63bf8,0x00000000da800000
0x00000000b0000000表示是 OldGen 的起始地址0x00000000d7a63bf8表示是使用到的地址.b0000000 ~ d7a63bf80x00000000da800000表示 OldGen 的结束地址
Dump 内存快照
jmap -dump:format=b,file=/tmp/heap.hprof PID
打开 MAT
开启个选项
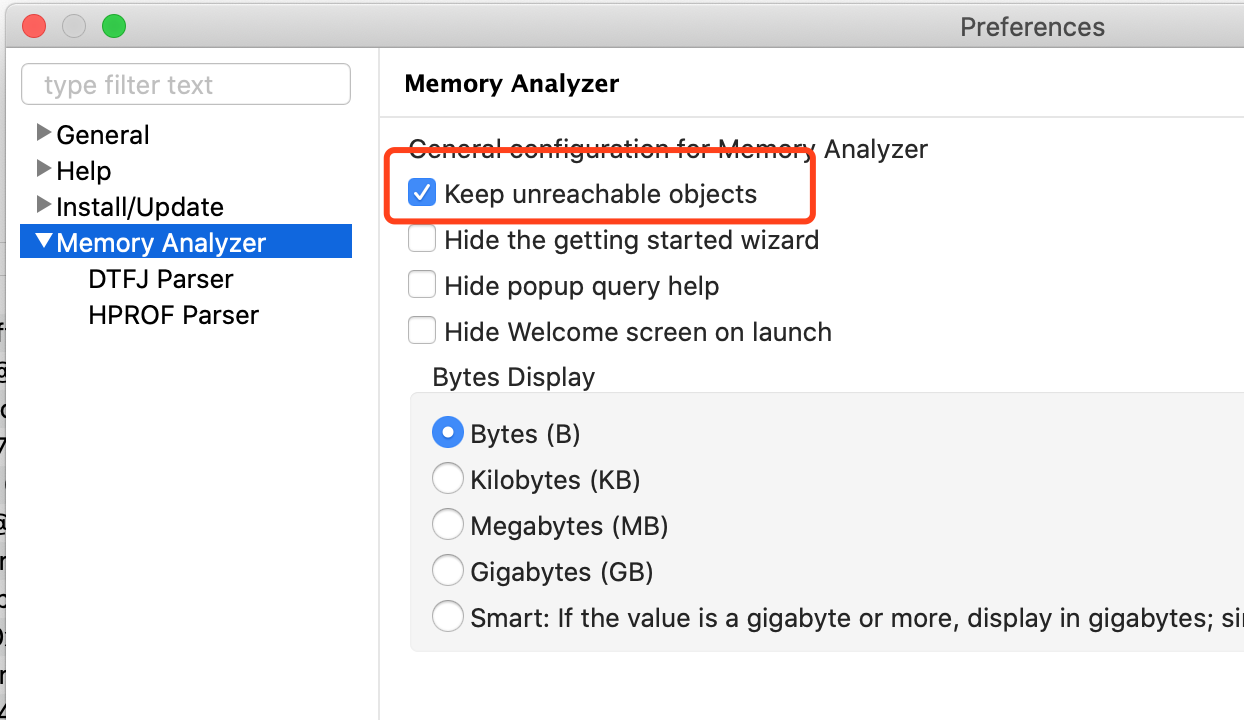
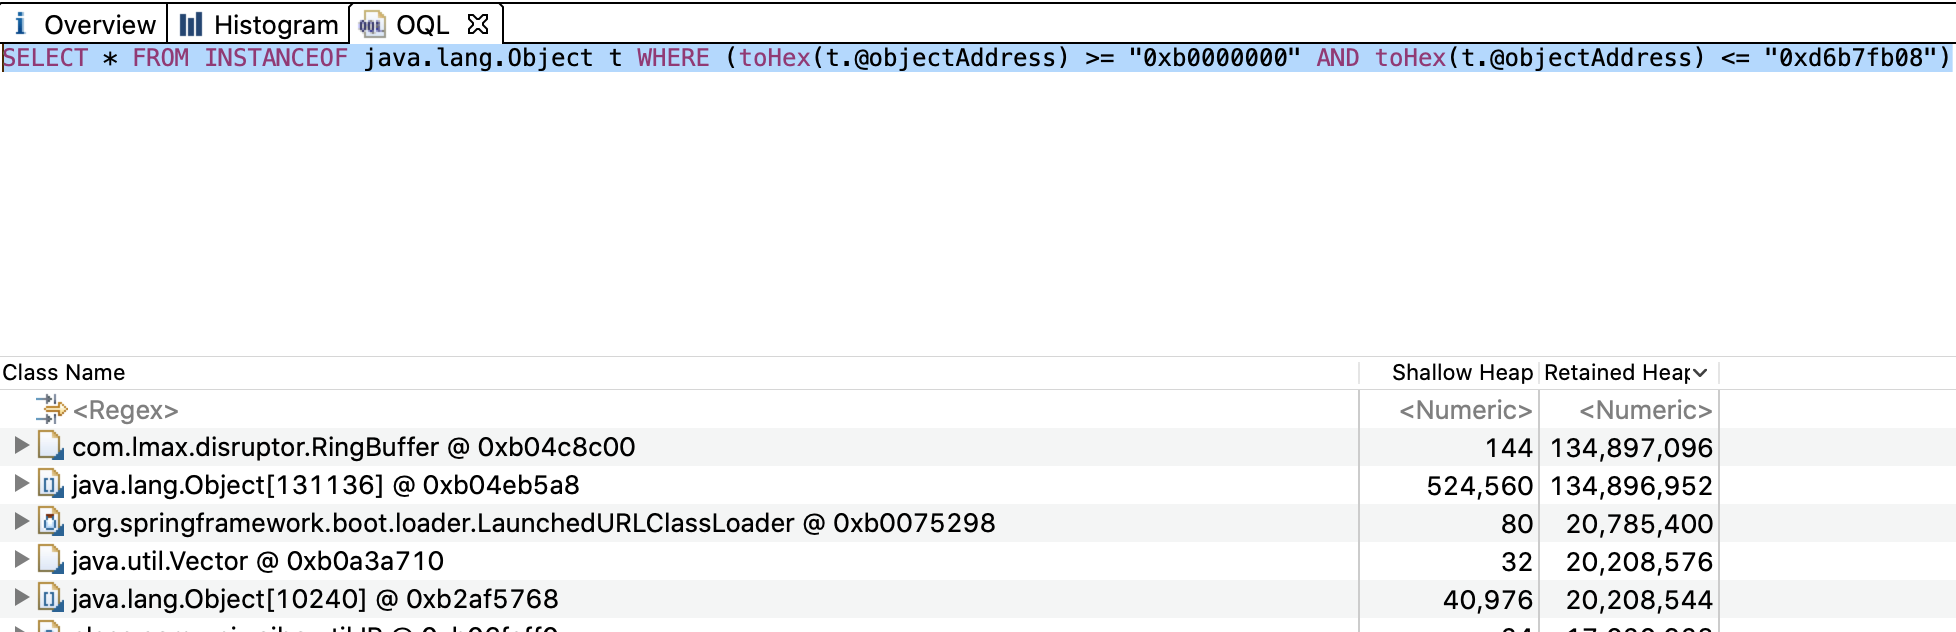
然后导入刚才生成的内存快照文件, 打开 OQL 查询, 输入
SELECT * FROM INSTANCEOF java.lang.Object t WHERE (toHex(t.@objectAddress) >= "0xb0000000" AND toHex(t.@objectAddress) <= "0xd6b7fb08")
参考资料
https://blogs.oracle.com/poonam/how-do-i-find-whats-getting-promoted-to-my-old-generation